
Home
Background
Interpretation
Manx Projects
Y-SNP analysis
Overview
Y-SNP testing involves considering a much larger set of mutations than Y-STR testing does, but with each of those mutations having a much smaller chance of occuring each generation. (As an example, the FTDNA BIG-Y tests over one million Y-SNPs, expecting on average one mutation roughly every 80 years across all of these.) These means that the raw DNA results are much larger and therefore harder to work with, but that the conclusions which can be drawn from comparisons are unambiguous.
The discussion below is based on the mainstream BIG-Y test for Y-SNPs. As an alternative to this, it is also possible to get a Whole Genome Sequencing test from one of a number of genetics companies. Such tests should provide much more data (in that they analyse all chromosones, not just Y), but typically without much in the way of comparators or analysis. Other considerations are the accuracy and comprehensiveness of the results provide (which will vary by provider and test), and privacy considerations (since the test reveals personal information, including susceptibility to various diseases). The limitations in comparators and analysis can be partly addressed through paid services offered by Yfull.com .
Y Tree
Every living shares a common patrilineal ancestor who lived about quarter of a million years ago. The Y tree connects every available Y-DNA profile back to the original human male through branches representing distinct lines of descent. These trees provide ancient ancestral information, but also support modern records based genealogical analysis. FTDNA automically add new BIG-Y test results to their large tree. To illustrate the tree, and the process, a much simpler example is shown below.
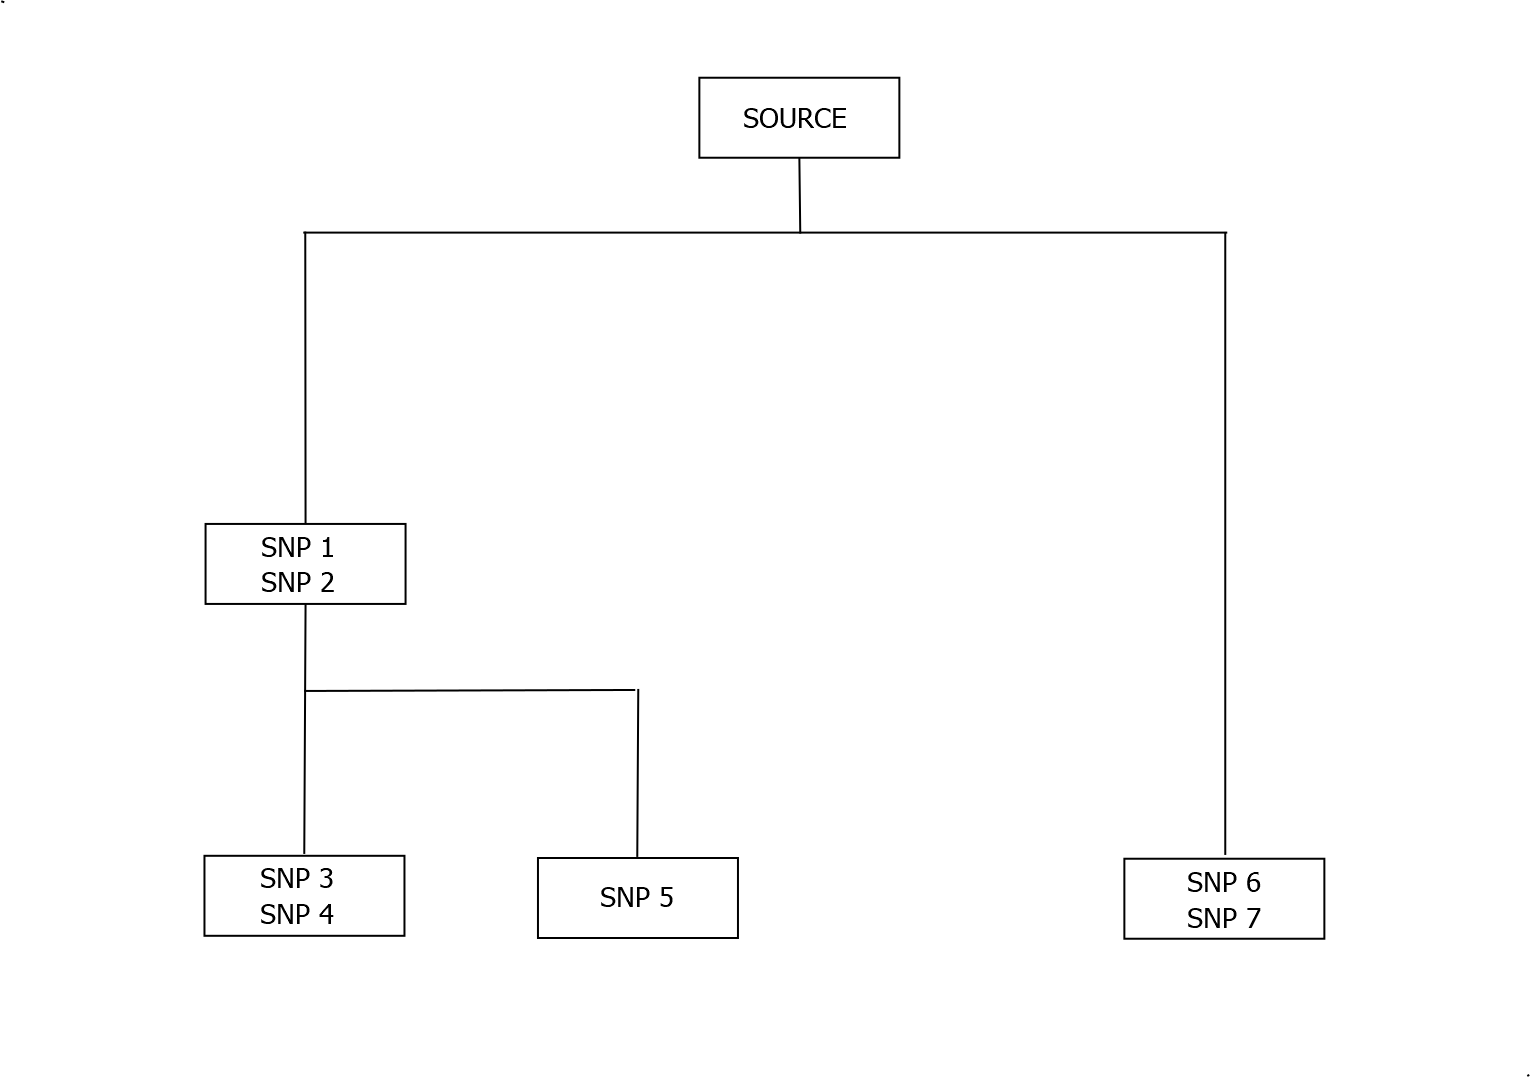
In the above tree each box represents an individual having all of the SNP mutations named in the box, together with all of mutations in the boxes above. The individual in the bottom left therefore has SNPs 1,2,3,4 but not SNPs 5,6 or 7. The mutations SNP 3 and 4 may not have occurred in the same generation though. Typically boxes in the Y Tree are separated by multiple generations
At the time of writing, this is based on about quarter of a million individuals. As more Y-DNA tests are done, the Y Tree is constantly being refined and expanded. The image below shows how the above tree would be updated if a new test revealed an individual with the source SNPs together with SNPs 6,8 and 9.
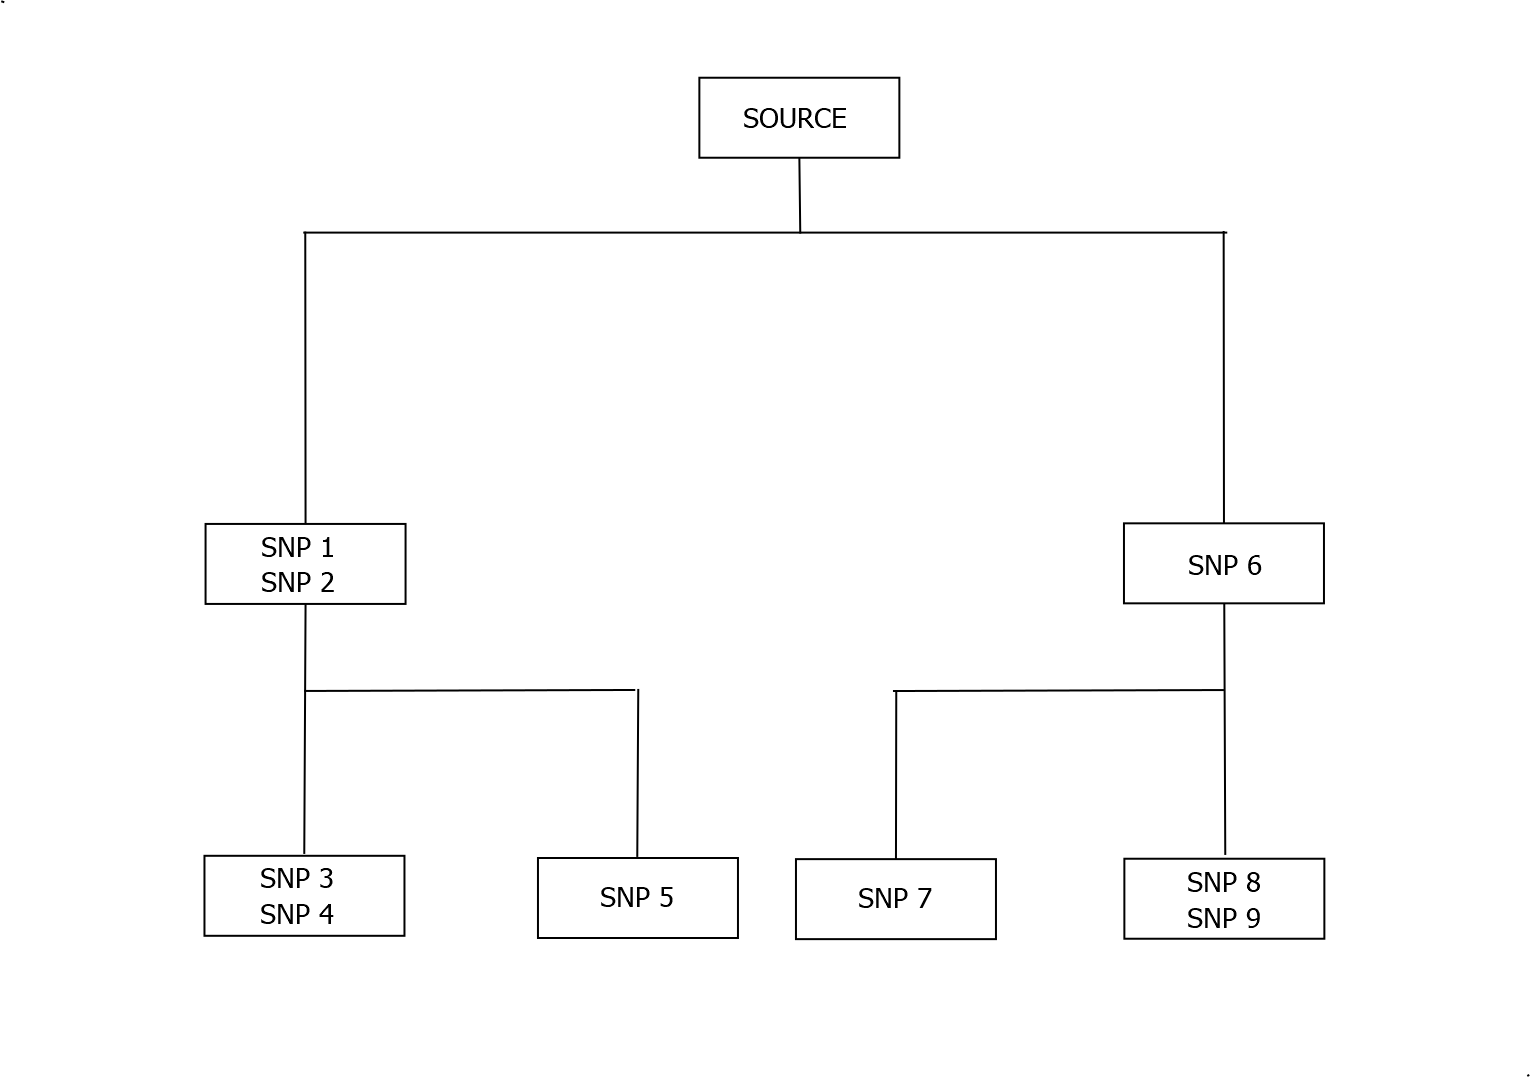
As shorthand, lines of descent are typically represented by a single SNP per box. The line of descent of the bottom leftmost box could therefore be represented by Source > SNP 1 > SNP 3 . Individual boxes are sometimes missed out to provide a shorter path (e.g. Source > SNP 3) and the final named SNP may be used as the defining haplogroup for an individual ( SNP 3). All of these representations will potentially change every time the tree is updated.
Each SNP is defined by its corresponding position within the reference human genome, together with the precise difference occurring at that position. Typically SNPs have been given names by testing organisations. (Some, rather confusingly have multiple names.) SNPs which have only been seen in one individual (and therefore can only appear in a box on the lowest level) are normally treated as "private" variants and are not published, given names or used on public Y trees.
There is a very small possibility of an SNP "back mutation", that is to say a mutation higher up in the tree being reversed at a later generation. This of course can be similarly represented though. Individual SNPs can (and sometimes do) occur by chance in more than one place in the tree. The multitide of other variations means that the chance of any ambiguity between two lines of descent is negligible.
Use for Genealogy
Bulk Y-SNP testing for genealogical purposes is both more recent, and significantly more expensive, than the corresponding tests for Y-STR markers. As a result there are often many more Y-STR results available for surname studies. It makes sense to combine both to provide a more complete ancestral tree. A natural approach is to use the relevant section of the Y-Tree as a framework (since this is virtually certain to be correct), and then to estimate Y-STR profiles for each node and use these to incorporate the Y-STR only profiles. The resulting tree should both inform genealogical record based research, and be enhanced by it.
The estimated Time to the Most Recent Common Ancestor (TMRCA) of two individuals (or more generally the time between two nodes on the Y-Tree) is not very reliable. There is a high variance, which is further exacerbated since Y-SNPs mutation rates depend upon the regions which they are in. FTDNA and YFull both provide estimates, but often with wide margins of error.
For most genealogical purposes we will be focussing solely on a small part of the Y-tree, typically all descendant lines from a particular ancestor who died a few hundred years ago. Bulk Y-SNP testing produces a large amount of output on hundreds of thousands of SNPs, but only a tiny proportion of those will have appeared within that time period on any of those descendant lines. We need to know which those SNPs are, and to be able to track their presence carefully. This motivates paying particular attention to private variants, which aren't shown on public trees.
Identifying private variants
As part of the results of a Big-Y test, FTDNA will provide details of all unique SNPs which were detected. These won't however include SNPs which are unique to the tester's ancestry line, if anyone else (in any part of of the Y-tree) has previously exhibited them. The simplest way to get a full list of private variants is to use the published list of differences with a close match. Any of these SNPs which the tester has will necessarily be on his distinct ancestral line, and will typically be private variants.
Analysing raw DNA data
It is possible to take a deeper look at the Y-SNP results. This could to compare Y-SNP results from different providers, to take a more thorough look at no-call (inconclusive) SNP results or simply to get a better understanding of the process.
The Variant Call Format (VCF) file (as produced by FTDNA and some other test providers) is a large text file contains one line for each Y-chromosone position tested. The most likely possibility for that position is given, along with a score and other supporting information. This file can be used to produce a list of the Y SNPs present and absent.
We often need to convert between the specification of an SNP (as given for example in a VCF file) with an SNP name (as it typically appears in the FTDNA outputs). One way of making this conversion is the Ybrowse tool on the ISOGG site. This free tool shows all of the named SNPs which can occur in a specified region of the reference Y human genome, and it can be searched manually using using the SNP position or name. It also allows us to match difference names for the same SNP. All of supporting data can also be downloaded at a csv file.
A Binary Alignment Map (BAM) file is an efficiently stored and compressed version of the corresponding Sequence Alignment Map (SAM) file. These contain the raw data output of the testing process, and are the used to produce VCF files. Both (especially SAM files) are extremely large and will require special software to process. Much of the information in the these files corresponding to a specific SNP can be viewed in FTDNA's Y Chromosone Browser when clicking on a particular SNP test result. The screen will show the various strands found which were aligned to the target Y-chromosone position, and allow the human viewer to assess the evidence for a specfic variation or varations from the reference human Y chromosone.